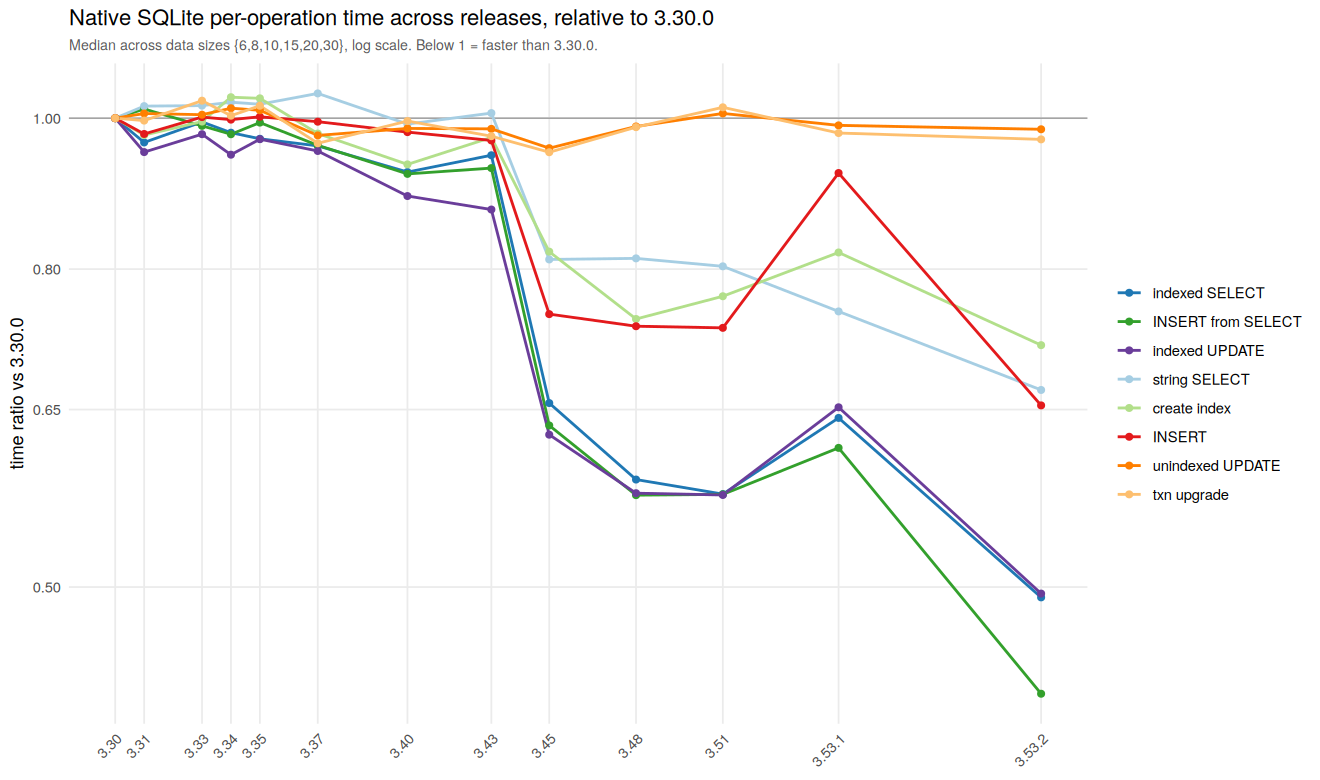
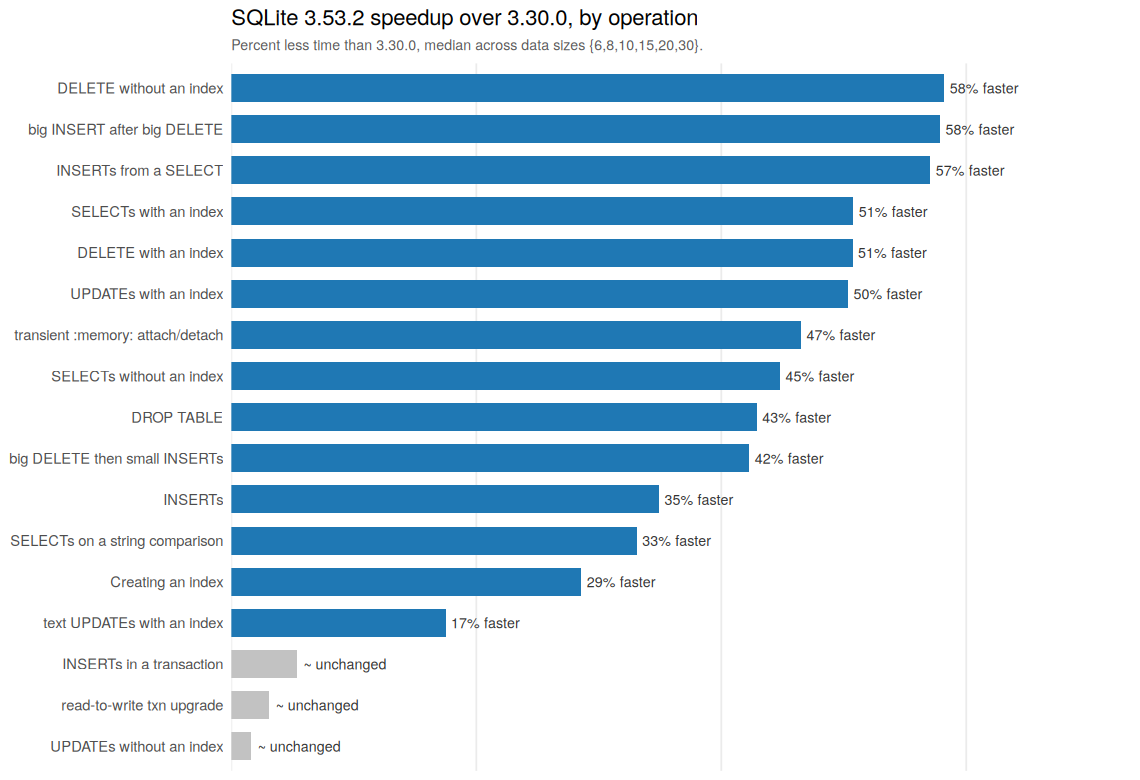
Native SQLite performance (as measured by an enhanced version of SQLite's speedtest.tcl) show where its per-operation performance changed across four years of releases. The improvements are quite bursty, and in the end after a significant regression, as of 3.53.2 is a lot faster for many operations than 3.30.0. A few operations hardly changed.
This could be quite helpful if you are constrained as to which upgrades are possible or how often you can upgrade. If you can't upgrade to the very latest then there are others you might wish to use and one you really don't.
Plots
Highlights and analysis advice
If its performance you're looking for, don't bother upgrading within the range of SQLite Releases 3.31 through 3.43. There may be other reasons, and you may have other performance criteria than those measured. But for most ordinary workloads this is is a reasonable guide because nothing much changed in this interval.
If you can't run the very latest SQLite for some reason, then choose somewhere between 3.43.0 and 3.45.0 because this was the biggest jump.
There was a write regression at 3.53.1 , which wasn't fixed until 3.53.2 . So you don't want to use SQLite versions in this range if performance matters to you. The measures we noticed going slower were: plain INSERTs by 30%, transactional INSERTs by 15%, and indexed text UPDATEs by 11%.
Beyond fixing the write regression, 3.53.2 improves on 3.53.1 on most operations, and on 3.30.0 on most things.
Method and reproducibility
The downloadable benchmark data contains a 4,251 runs on July 2, 2026. Of these, 2,481 runs are native SQLite:
$ tclsh tool/benchmark-filter.tcl -no-backend -count -db $DB
2581
The LumoSQL benchmark suite ran 18 operations against unmodified SQLite builds listed here:
$ tclsh tool/benchmark-filter.tcl  -stats -group-by sqlite-version -db $DB
SQLITE-VERSION  RUNS    AVG_S   MIN_S     MAX_S  AVG_RD_S  AVG_WR_S
--------------  ----  -------  ------  --------  --------  --------
3.30.0           100  490.391  47.536  1846.405     0.981     1.989
3.31.0           100  491.979  12.012  1831.463     0.857     1.989
3.33.0            99  489.114  12.699  1806.346     0.720     1.900
3.34.0           100  477.948  23.448  1479.047     0.961     2.066
3.35.0           100  546.281  26.297  1910.014     0.993     2.124
3.37.0           100  545.865  26.303  1958.052     1.101     2.143
3.40.1            99  536.384  27.385  1738.574     0.981     2.101
3.43.0            99  534.027  28.591  1626.056     0.926     2.051
3.45.0           100  391.573  28.936  1679.635     1.142     2.294
3.46.0            36  391.927  30.113  1666.306     1.158     2.268  <-- excluded due to small n
3.48.0            99  384.193  26.950  1534.360     1.151     2.366
3.51.0           100  387.682  28.869  1558.079     1.101     2.262
3.53.0            12  330.758  95.351   820.360     0.640     1.768  <-- excluded due to small n
3.53.1          2068  267.420   7.283  2255.836     0.852     1.985
3.53.2          1039  296.018  16.302  1218.257     0.919     2.045
All runs were done on the same moderately high-end machine as shown by:
$ for k in cpu-comment cpu-type os-type os-version byte-order word-size; do
  echo "== $k =="
  tclsh tool/benchmark-filter.tcl -db $DB -stats -group-by $k
done
which shows it was an AMD EPYC 9334 32-Core Processor running Linux with various other details.
Each operation's time is expressed as a ratio to the 3.30.0 median for the same operation and data size, then the median is taken across data sizes. A data size is a multiplication factor, in this case of 6, 8, 10, 15, 20 and 30x. A ratio below 1.00 means faster than 3.30.0. Confidence intervals are 95% over runs. Data sizes below 6 are excluded because there is too much noise variability. The benchmark operation "Creating database and tables" is omitted because it is so fast and it is a one-off operation that it doesn't seem significant for these purposes.
The R code for the plots is in benchmark/plots/ together with the images.